

More and more software companies are realizing how important is to have a solid developer community and start hiring DevRel roles for their core business. Tracking and collecting evidence of how your actions are performing to know if you’re archiving the established goals, is crucial when implementing DevRel programs.
For measuring the marketing mix of a specific DevRel program (e.g, events, documentation, trainings) there are indeed good tooling and well defined metrics. However, that’s just the top of the iceberg, and is time to face that DevRel activities go far beyond from that.
Beyond marketing activities, there is little information about what and how DevRel programs should be measured. In this post, we share a list of the most useful metrics and KPIs for DevRel based on different touch points developer audiences interact with and the developer funnel model stages.
The DevRel role diversity “issue”
DevRel role is still unclear to many people. One of the main reasons is because a DevRel can be hired by companies, but also by foundations. And in both cases, they might have proprietary or open source projects. DevRel roles have different goals, which makes it even more difficult to establish uniform procedures when measuring goals.

Nonetheless, all these DevRel roles share one thing in common, Developer relations always need to engage, acquire and satisfy developers with a software product.
Best practices to measure engagement: The developer journey
Awareness and outreach (the activities you undertake in order to drive someone from not knowing your product to becoming a customer) might be the most visible part of developer relations. As mentioned before, nowadays we can find good tooling and well defined metrics at that point. But what about the rest of DevRel activities? Are they being measured in the right way?

Community, Product and Education&Support. All these pillars are established in any DevRel program and need to be measured too.
Let’s focus on community and product just for now. What are the different profiles a developer can go through? What are the different developer personas a DevRel should be measuring?
- Users: Those developers who downloaded documentation, installed an API,etc. Is just a newbie that had low interaction with the product itself. This is what current tooling based on measuring the marketing activity from DevRel programs focus on.
- Most valuable users: Those developers that want to learn more about the software product, start asking questions and are being more proactive.
- Contributors: Developers that feel confident enough with the software product to answer questions and even send pull requests for code review.
- Maintainers: Those that do code commit and code review process. They’re experts about the field and have control over the software product. This last phase is more important for a DevRel that is hired by a Foundation or an OSS project.
Thus, in order to measure engagement, we should focus on these profiles and identify them across the different touch points where a developer community is (e.g, StackOverflow, GitHub, GitLab, Twitter, Mailing lists, Reddit).
We need to highlight that developer audiences can show interest in many different areas (e.g, IoT, VR/AR, Data Science, Cloud, Machine learning, Games, Web) and touch points differs from one developer audience to another.
Set of KPIs for DevRel Programs
First we should know what are we going to measure. As mentioned before, DevRel shares some goals in common regarding acquisition, engagement and developer satisfaction. Thus, we will present a set of KPIs based on these three focus areas. Let’s take a look at them:
- Engagement: Main purpose is to create and maintain relationships with the developer community.
- Acquisition: Main purpose is to grow my developer community.
- Satisfaction: Main purpose is to be perceived as an attractive project by my developer community.
Once we have defined what are we are going to measure, it is time to move to how are we going to measure these focus areas within my DevRel program.
1. Engagement KPI set
Developer growth by data source: This has direct impact on the developer funnel model. From the time a user becomes a “most valuable user” and starts interacting with your product, what is his/her activity across the different data sources over time?The following screenshot shows the number of activities of a single developer across different touch points (divided by colors). This example shows a developer that is becoming more engaged over time.

Developer growth by software product: This measures which software products or projects are the most popular ones among my developer audience. You can see the total number of authors (developers interacting among the different touch points) on each of the different software products your company (or foundation) has.
The following screenshot shows the number of single authors that interacts among the different software products. Darker colors show more developers during a time slot in a specific project.

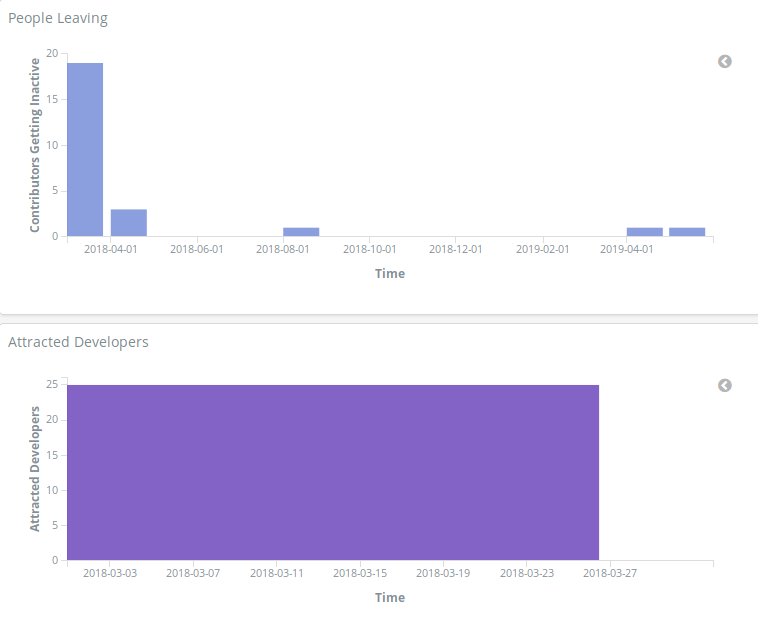
2. Acquisition KPI set
Developer’s retention rate: This shows how many attracted developers (newcomers) start using a software product or stop using it.

Moreover, we can go one step further and get the retention rate from the developer audience at a specific month.
3. Satisfaction KPI set
First time to attention ticket: as mentioned before, one of the first things a developer community does when transitioning from user to most active user is asking questions (on forums, collaborations hubs, etc). Because of that, it is very important to measure how fast are we answering those issues as a fast answer will directly have impact on a high developer satisfaction level.

First time to close tickets: It’s important to answer as fast as possible to developers issues, but is also important to provide them a solution as fast as possible For this reason, time to close should be also added when measuring developer satisfaction levels.
Tooling used for measuring DevRel Programs
Once we’ve specified what we are going to measure and how we are going to do it, It is time to think about where we can measure all this. In other words, the tooling we can use to get all these insights with gathered information.

The screenshots in this post were created using the information Bitergia Analytics (based on the CHAOSS GrimoireLab free, open source project) is already providing to some projects such as CHAOSS project itself.
Despite other DevRel measuring tools that only focus on first-level users and marketing efforts, Bitergia Analytics focus on measuring the most valuable users, contributors and maintainers from any developer audience, analyzing the different touch points those developers interacts with in just one single dashboard.
If you are a DevRel interested in getting far beyond than marketing insights and acquire a complete view of how your DevRel program is actually performing , just contact Bitergia!


